Scale of graph in android smart weather app is wrong
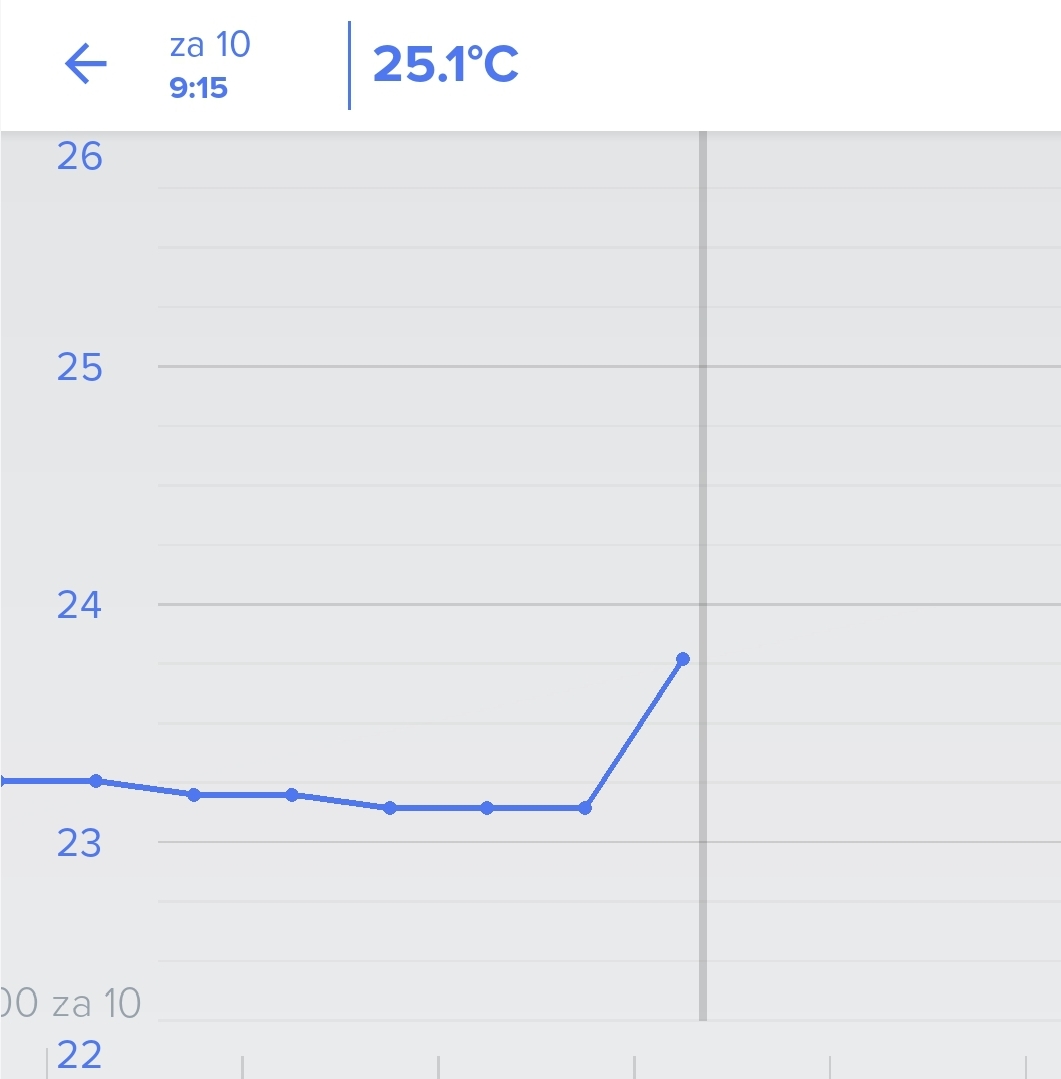
I was just looking at a temperature graph in the android weather app and noticed that the scaling of the graph is wrong. In the example below the measured temperature is 25.1°C but on the graph the dot is at about 23.8°C.
Comments
23 comments
I have realized the same annoying problem some time ago. It only appears in Android app, not in iOS or web apps.
(I found this forum yesterday and did not find any post on this topic. Now I was about to start writing a new post about it, but surprisingly I realized that this one had been submitted just two hours ago.)
Just noticed this with the indoor air quality monitor temperature graph too and Android. I have a screen grab but not sure how to post it.
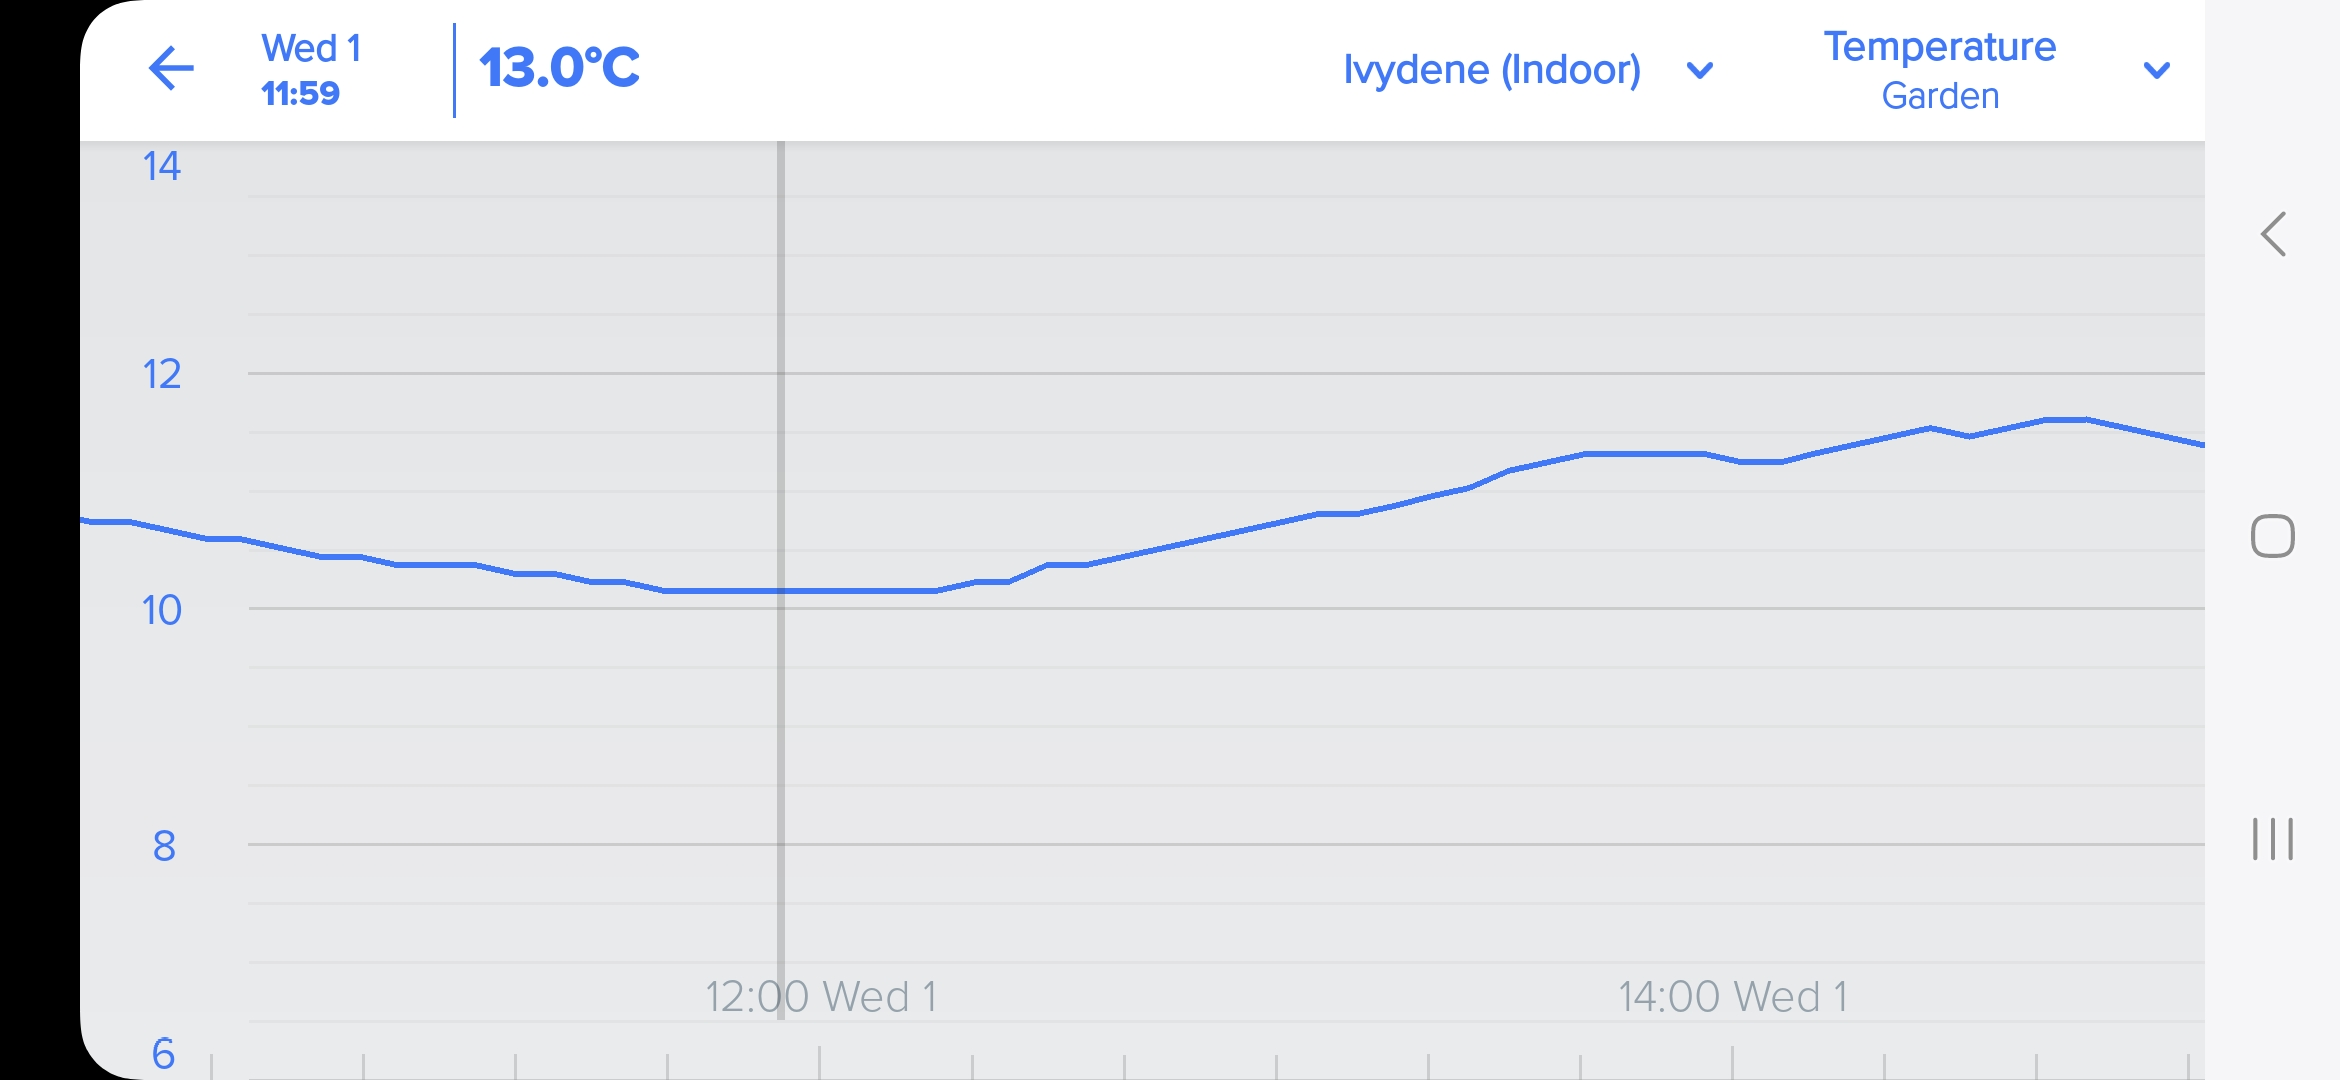
I have had this problem for a while, the reading at the top of the screen doesn't correlate with the graph or the numbers up the side of the graph.These 2 screenshots are both done on the same day, just a few hours apart.
Anyone got any idea how to sort it?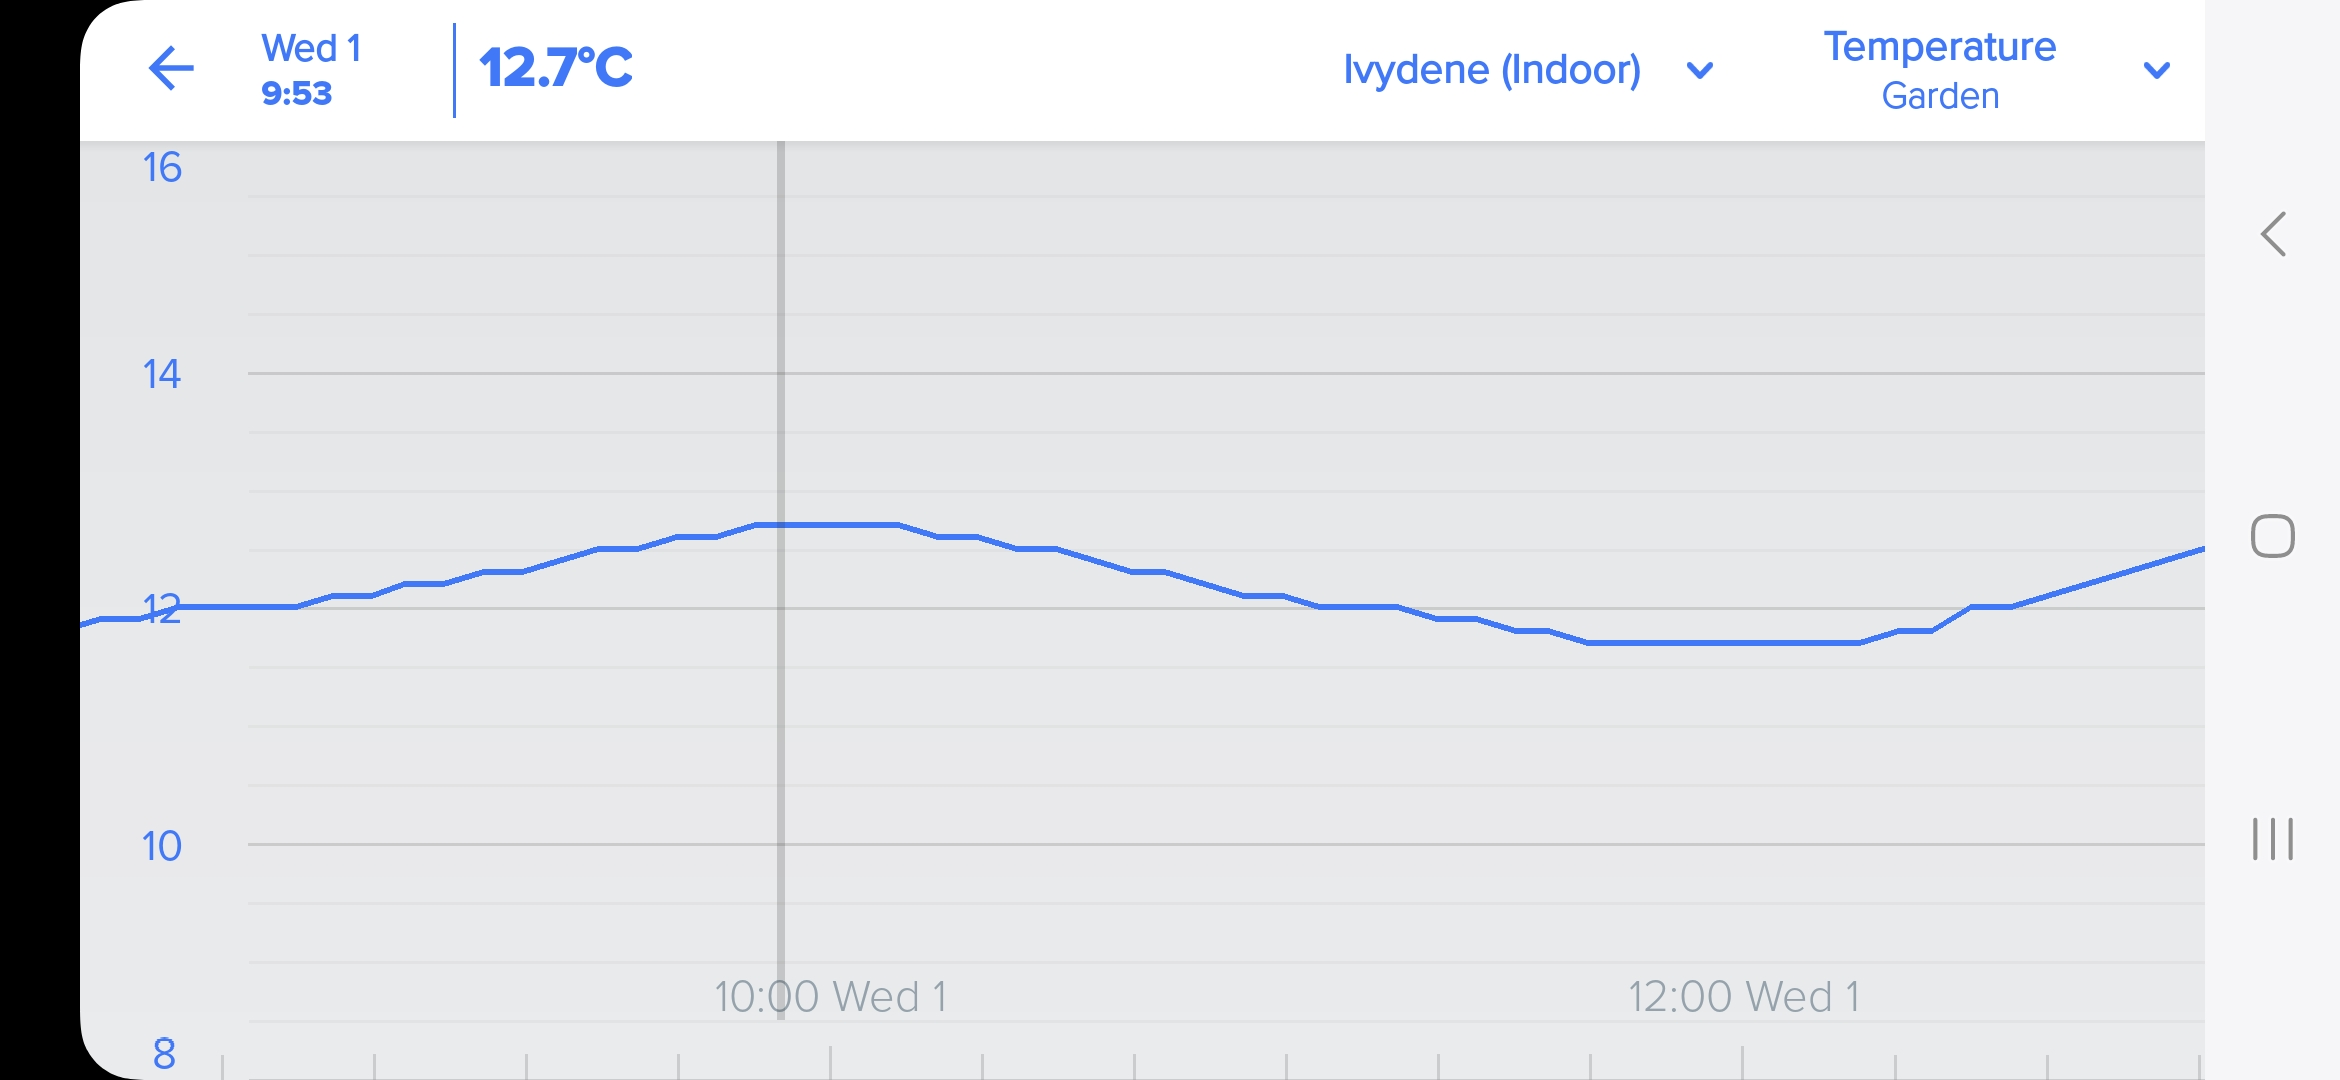
Looks like the newest app update has fixed the problem 🙂
How do you get the latest app update. Doesn't seem to be an option on the app to update, so I uninstalled, then reinstalled, but I've still got the problem.
Hmmm yeah I might still be on the beta channel for this app...
I think the new weather app version from 26 Aug is on the web browser version of the Google play store.
But for me it just installs 4.5.3.1. So maybe you only get newer version if in beta program.
I'm on 4.6.0.1
Like William says, it's version 4.5.3.1. How can you upgrade to the newer version?
You'll have to wait until the new version is released... at least you know it will be fixed 🙂
Version 4.6.0.1 is now in Google Play but it does not solve the problem, not even after removing the app and reinstalling it. The temperature graph below shows a little less than 22 degrees even though the correct temperature is 22.3 degrees. A more extreme example is the rain gauge graph on the bottom, showing 2 mm according to the scale on the left even though the correct reading is 0.5 mm.
One of the problems I've got is that neither the side bar or the line on the graph ties up with the readings at the top. In some cases as the graph line goes down, the readings at the top go up!
You are right it is't fixed... 🙄
I contacted Netatmo's technical support about the problem and got the following reply from their technical specialist: "I've forwarded your comment to the dedicated team so that it can potentially be included in a future update."
I have the same problem, how annoying! Also on Android, all updates.
I would like to add my problem is with the Thermostat!
Same problem here, very annoying... When will this be fixed?
I wonder if it would make fixing the problem any faster if everybody submitted a request on this topic directly to Netatmo following the instructions at https://helpcenter.netatmo.com/hc/en-us. Perhaps after sending a couple of "I've forwarded your comment to the dedicated team so that it can potentially be included in a future update" replies Netatmo would really start doing something.
We get different readings depending whether we go by the reading at the top of the screen, or whether we go by the figure on the graph. Which is correct?
I have Android app version 4.8.1.0 and still have same problem with bad scale. Do you anyone know about any solution?
I have same problem. Version of app android is 4.8.1.0 . How can solve it?
Same here. All fine on the website report. Mismatch on app Energia 4.8.1.0. used to manage the smart thermostat