Question about Web Portal
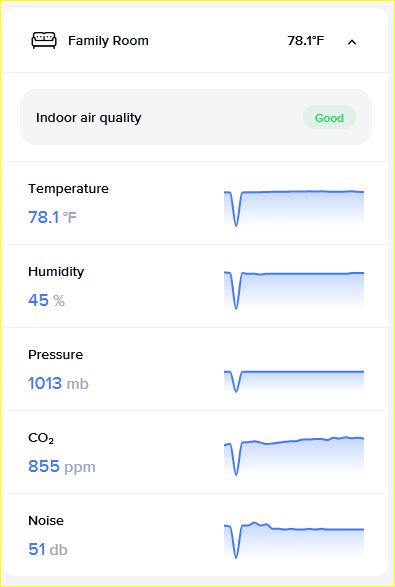
On the right hand side of the Home page in the web portal there is a column that provides an overview of all the modules with the current value for temperature, humidity, etc. There is also a small graph to the right of the value depicting recent historical readings. Does anybody know the date range of these graphs? They do not appear to be for the last 24 hours and I am not sure but they also do not appear to be for the last week. I can't tell what date range they cover or frequency, i.e. every 10 minutes, every hour, etc.
Comments
0 comments